Where to Check WurQ results?
- On the History Page, you'll be able to see the list of all the workouts you've done. Grouped by two tabs namely Class and Benchmarks.

- On the first image, the grey card means, your file is being processed by the WurQ.
- Once the session is processed, you'll receive a notification that says "Your session is Ready".
- The Grey card will change into a live workout card - Where you can see the results.
Let's see how you can utilise the Results?
Understanding WurQ Power
- Your body is an engine, and we measure how much power it generates to understand your work capacity across broad time and modal domains.
- For information on the science behind power, please see (link) — in simple terms, more power is better for both wellness and performance.
- For every WOD, we’ll show you the power you generated. You can choose to compare your WurQ power against your personal best or see how you stack up against others who completed the same WOD.

We then break it down to show what contributes to your power production:
- Rest time in transitions and breaks.

- Rep cycle for each movement. This value shows how many seconds it takes on average to move from rep to rep across rounds, as well as in comparison to other athletes.
- Range of motion—if your range of motion reduces due to fatigue or imperfect technique, this will result in less work completed, and therefore less power. You can assess your range of motion round by round.

- For cardio movements like running, rope jump, rowing, etc., we use MET estimates to calculate work and power..

Understand your Heart Rate Stats
AVG HR - Average Heart Rate for your entire WOD.
Max HR - The maximum Heart Rate reached while doing the repestive movement.
Calories - Number of Calories burned during the WOD.

Track Your Heart Rate During the WOD
• Hover over the graph to view heart rate fluctuations at each second of the WOD.
• Check how your heart rate performed during each round of the workout.
• Identify different heart rate zones by their respective colors.
• Analyze overall heart rate trends by reviewing your average HR.

Understand your Heart Rate By Movement
See how each movement elevates your heart rate to a different training zone.

Explaining the Time Stats: (RFT)
Time: Total time it took you to complete the WOD
Avg Time : Average time it took to for your selected group to complete the WOD
Rest : Total time you took while resting and transitioning from one movement to other.
Rest % : percentage of Rest compared to your total workout time.
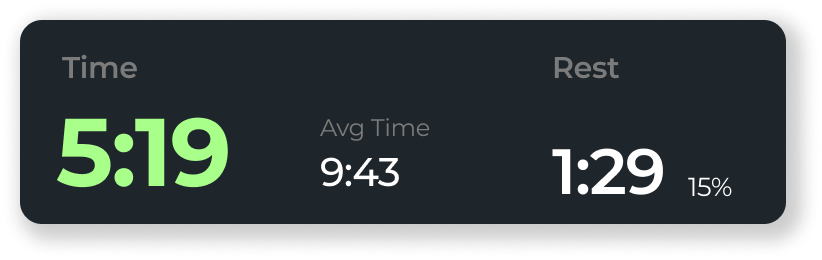
(If you finish your WOD before the Group Average, your WOD time will be highlighted in green)
For more WOD details check this link
Explanation of Pace Graph - RFT
Pace Comparison: The graph compares your WOD pace against the group average.
X-Axis: Displays the duration of each round or the total WOD duration.
Y-Axis: Represents your pace relative to the group average, with the baseline showing the average pace.
Movement Breakdown: Your movement times are compared to the average, highlighting if you were faster or slower.
Info Bar: Shows clock time of movements in bold, with the “+/-” indicating your pace difference and the movement name.


Understanding The automatic Movement Detection:

- The exact details down to the second for everything that happened in your WOD. Did we mention Automatically without input?

- If you had to break the set, we will detect it and count breaks.

- We detect each round, count reps, and show transitions between movements.
- If you completed any particular rounds faster than the average group, you will see a green arrow.

- If you see any discrepancy in your results, please share it with us via the feedback button.
Climb the Leaderboard: Use Your Rank to Push Harder and Beat Your Best

The leaderboard not only shows your current ranking but also highlights your previous performance. This allows you to track improvements over time, providing valuable insight into how your training is progressing.
Was this article helpful?
That’s Great!
Thank you for your feedback
Sorry! We couldn't be helpful
Thank you for your feedback
Feedback sent
We appreciate your effort and will try to fix the article